
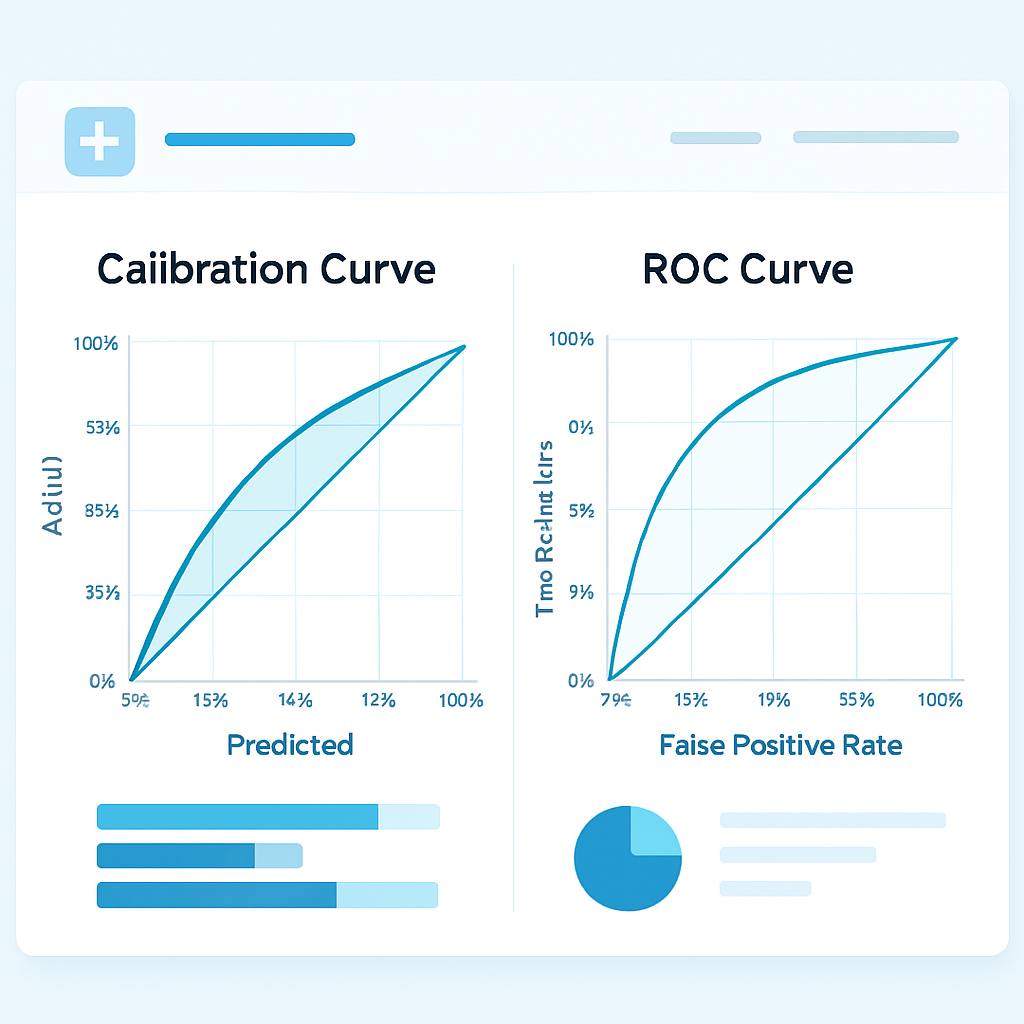
The AUC Obsession
When healthcare AI vendors pitch their products, you'll almost always hear about their AUC (Area Under the ROC Curve). "Our model achieves an AUC of 0.85!" sounds impressive. But what does that actually mean for clinical use?
AUC measures discrimination—how well a model ranks patients from lowest to highest risk. An AUC of 1.0 means perfect ranking; 0.5 is random chance. But here's what AUC doesn't tell you: whether the predicted probabilities are accurate.
Why Calibration Matters More
Calibration measures whether predicted probabilities match observed outcomes. If a model says 100 patients each have a 20% readmission risk, we'd expect about 20 of them to actually be readmitted. If 35 are readmitted instead, the model is poorly calibrated.
Clinical Decisions Depend on Accurate Probabilities
Consider this scenario: Your care management team has capacity for intensive post-discharge support for 50 patients per month. You want to target patients with >25% readmission risk.
With a well-calibrated model: Patients flagged as 25%+ risk truly have 25%+ risk. Your interventions are appropriately targeted.
With a poorly-calibrated model: Patients flagged as 25% risk might actually have 40% risk—or 12% risk. You're either missing high-risk patients or wasting resources on lower-risk ones.
Resource Allocation Requires Absolute Risk
Many health systems set intervention thresholds based on predicted risk levels:
These thresholds only work if the predicted probabilities are accurate. A model with great AUC but poor calibration could systematically over- or under-estimate risk, making these thresholds meaningless.
How to Evaluate Calibration
The Calibration Plot
The gold standard for assessing calibration is the calibration plot. Patients are grouped into deciles by predicted risk, and the observed readmission rate in each decile is plotted against the predicted rate.
A perfectly calibrated model shows a diagonal line from (0,0) to (1,1). Deviations from this line indicate miscalibration:
The Hosmer-Lemeshow Test
This statistical test formally evaluates calibration by comparing expected vs. observed events across risk groups. However, it's sensitive to sample size and should be interpreted alongside visual inspection of calibration plots.
Calibration-in-the-Large
This measures whether the mean predicted probability matches the overall observed event rate. A simple but important check.
Common Calibration Failures
Training vs. Validation Drift
Models often perform well on training data but poorly on new populations. Calibration degrades when:
Overconfidence
Some ML models, particularly tree-based ensembles, tend to predict probabilities clustered near 0 and 1, rather than well-distributed across the probability range. This "overconfidence" reduces calibration quality.
Temporal Drift
Healthcare changes over time. Models trained on 2019 data may be poorly calibrated for 2024 patients due to changes in care delivery, patient expectations, and documentation practices.
What to Demand from Vendors
When evaluating healthcare AI solutions, ask for:
1. **Calibration plots on external validation cohorts** - not just internal test sets
2. **Calibration metrics by subgroup** - performance may vary by age, diagnosis, or payer
3. **Recalibration procedures** - how often is the model updated for your population?
4. **Performance monitoring** - ongoing tracking of calibration drift after deployment
Marqi Index Calibration Performance
Marqi Index achieves calibration within 2% across all deciles in external validation:
| Predicted Risk | Observed Rate |
|---------------|---------------|
| 5% | 4.8% |
| 10% | 9.7% |
| 15% | 15.3% |
| 20% | 19.6% |
| 25% | 25.8% |
| 30% | 29.4% |
This level of calibration means clinical teams can trust the predicted probabilities for care planning and resource allocation decisions.
Conclusion
AUC tells you whether a model can rank patients by risk. Calibration tells you whether you can trust the actual risk numbers. For clinical use, calibration often matters more.
Before implementing any readmission prediction tool, demand calibration evidence on external populations. Your care management resources—and your patients—depend on predictions you can trust.